How I Built a Custom GoHighLevel Dashboard for a Client (Win/Loss, CSR Performance & Lead Tracking)
When a client comes to you frustrated with their reporting, you have two options: patch it together with random widgets or rebuild it strategically.
I chose the second one.
This client was running their operations across multiple tools – CRM, spreadsheets, and separate call tracking software. We were consolidating the parts that mattered most into GoHighLevel: task management, speed to lead, and rep/CSR accountability. They didn’t need GHL to replace everything overnight. They needed it to handle their specific workflow, cleanly and accurately.
The problem? Their default GoHighLevel dashboard was giving them noise, not insight.
Here’s exactly how I rebuilt it, and why every decision was intentional.
Why Their Default Dashboard Wasn’t Working
Before we get into the build, let me tell you what they actually needed:
- Win/loss tracking broken down by trade
- Revenue visibility by lead source
- CSR performance tracking
- A clear split between business hours and after-hours leads
The default GoHighLevel dashboard couldn’t surface any of this. The widgets were too generic, the filters weren’t set up for their business model, and there was no structure behind what was being shown.
So instead of adding random widgets and hoping for the best, I rebuilt their entire reporting system from scratch with a clear strategy behind it.
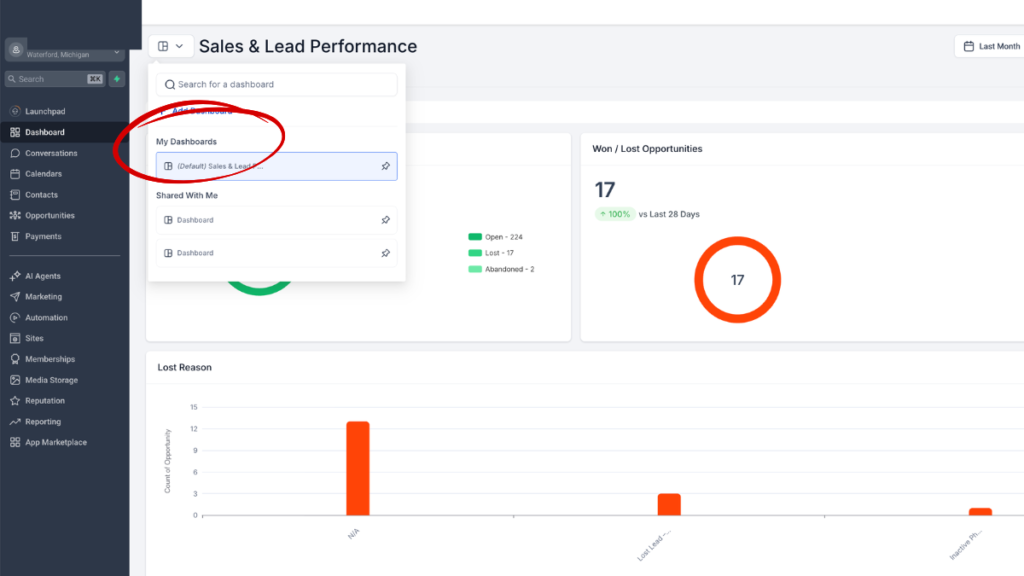
How to Create a Custom Dashboard in GoHighLevel
If you’re new to this, here’s the quick setup before we get into the strategy:
- Go to Dashboard in the left-hand sidebar
- Click Select Dashboard at the top
- Hit Add Dashboard
- Start building from there
That part is easy. What most people get wrong is everything that comes after — which widgets to use, what to filter by, and how to structure it so the data actually means something.
Understanding What Reports Are Available in GoHighLevel
This is something most people skip over, and it kills their reporting before they even start.
GoHighLevel has a set of report types that every dashboard widget is built from. Each one has its own filters and conditions.
Here’s what is available:
| Report Type | Available Filters |
| Contacts | 17 filter options |
| Appointments | 15 filter options |
| Opportunities | 17 filter options |
| Visitor Data | 13 filter options |
| Emails | 11 filter options |
| Calls | 13 filter options |
| Conversations | 12 filter options |
| Payments | 17 filter options |
| Meta Ads | 16 filter options |
| Social Planner | 18 filter options |
| General | 15 filter options |
| Google Analytics | Available |
For this client’s build, we primarily worked inside Contacts and Opportunities – because that’s where their operational and revenue data lived. They weren’t running email campaigns or Meta Ads through GHL at this stage. Their use case was internal: rep task management, lead follow-up, and appointment reporting.
Knowing which report type to pull from before you touch a single widget is the difference between a dashboard that works and one that confuses everyone.
Want me to build this reporting system for your GHL account?
The Foundation You Need to Understand First: Contacts vs Opportunities
This is the most important concept to understand before building any team performance-related GoHighLevel custom dashboard.
GoHighLevel has two core objects that can help you set up and understand your performance as per your build.
Here’s how I set it up:
Contacts = Where Reps Operate
The Contact record is the workspace that was set up for the sales and CSR team. This is where the day-to-day work happens:
- Calls logged
- Notes added
- Tasks created and completed
- Follow-ups scheduled
- Nurture sequences running
The team lives inside the Contact records. That’s the operational layer.
Opportunities = Where Revenue Gets Reported
Opportunities are the reporting engine. This is where business performance lives:
- Pipeline movement and stage tracking
- Won/Lost status
- Revenue values
- Lead source attribution
- Trade and service type tracking
How I Structured the Dashboard: 3 Strategic Sections
I divided the entire dashboard into three sections, each designed for a different audience within the business:
- Executives see revenue and win/loss first
- Managers see rep and CSR performance second
- Operations sees lead volume and workflow data third
That top-down structure wasn’t accidental. It mirrors how decisions actually get made in a service business.
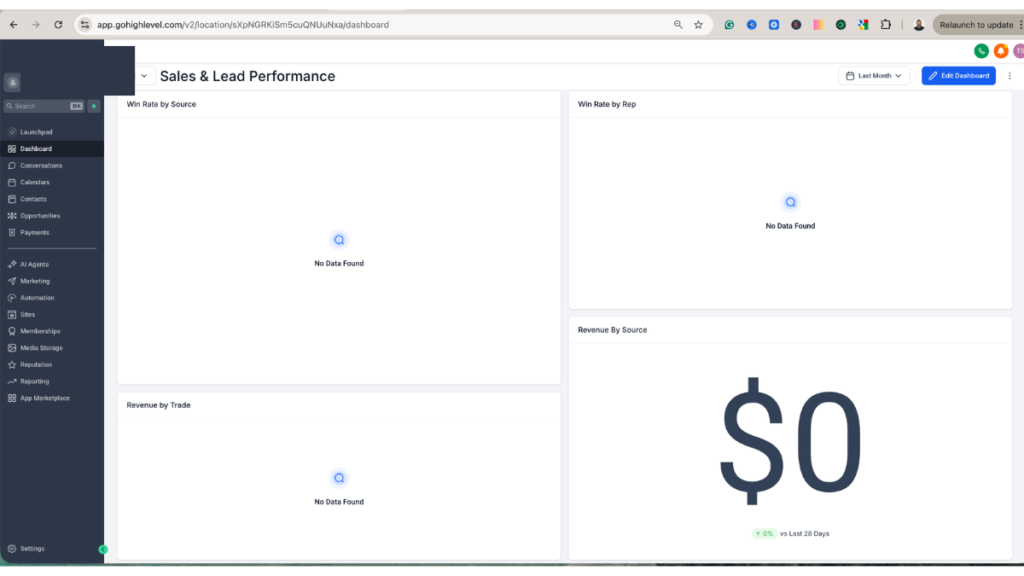
Section 1: Revenue & Win/Loss Performance (Opportunity-Based)
Every single widget in this section pulls from Opportunities. This is pure business performance data.
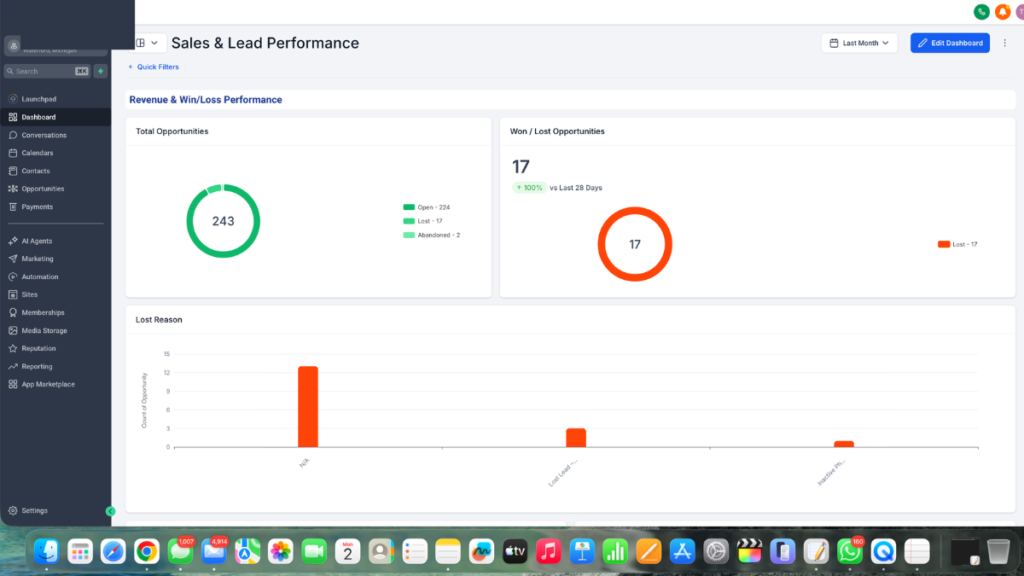
Win/Loss Breakdown
- Widget type: Count of Opportunities
- Filter: Opportunity Status
- Conditions: Status = Won OR Status = Lost
This gives you a clean ratio of won versus lost deals across any time period you select. At a glance, leadership can see if the close rate is moving in the right direction.
Lost Reason Tracking
- Widget type: Opportunities filtered by Lost Reason
- Condition: Status = Lost
Here’s what makes this one more powerful than a standard lost reason report: this client only runs sales calls after a lead enters the funnel. So every lost deal has a rep-logged disposition attached to it via a custom field. That disposition becomes the lost reason you see in the dashboard.
This means management isn’t just seeing that leads were lost — they’re seeing why, straight from the rep’s own notes. [Read the full case study on how I built the disposition and custom field system here →]
Win Rate by Source
- Widget type: Count of Opportunities
- Group by: Lead Source
- Condition: Status = Won
This answers the question every business owner wants answered: which marketing channel is actually closing deals, not just generating leads.
Win Rate by Rep
- Widget type: Count of Opportunities
- Group by: Assigned User
- Condition: Status = Won
Instant rep-level accountability. No spreadsheets, no manual tracking. You can see exactly which CSR or sales rep is converting, and who needs coaching.
Revenue by Trade
- Widget type: Sum of Revenue
- Group by: Lead Type (custom field)
- Condition: Status = Won
Lead Type is a custom field we built to tag each opportunity by the service or trade it falls under. When you sum revenue and group by that field, you immediately see which services are driving the most closed revenue.
Revenue by Source
- Widget type: Sum of Revenue
- Filter by: Lead Source
- Condition: Status = Won
Similar to win rate by source — but instead of counting deals, you’re summing dollars. A source might send more leads but close smaller deals. This widget catches that.
Together, these six widgets answered the client’s core reporting questions: where is the money coming from, which services perform best, which reps are closing, and where are deals falling apart.
Section 2: CSR Performance Dashboard (Contact + Task Based)
This section shifts from revenue to operations. It pulls primarily from Contacts and answers three questions:
- Who is handling which leads right now?
- Are leads actually being nurtured or just sitting in someone’s pipeline?
- Is any CSR overloaded while others are underutilized?
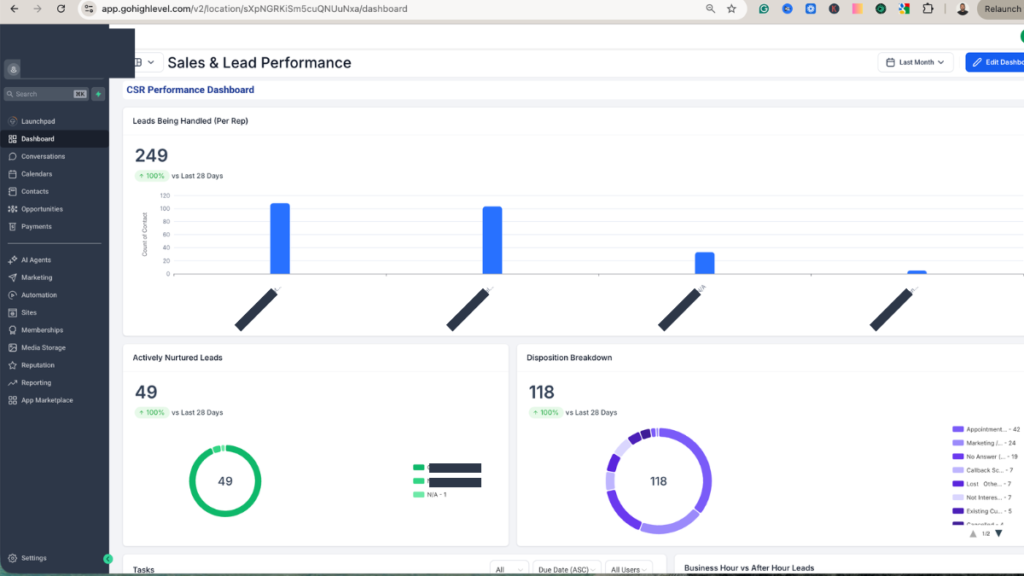
Open Leads Per Rep
- Widget type: Contacts
- Filter: Opportunity Status = Open
- Group by: Assigned User
This shows you the active lead load each CSR is carrying at any given moment. It’s your workload distribution view — essential for making sure leads aren’t piling up with one person while another rep has nothing to work.
Actively Nurtured Leads by Rep
- Widget type: Contacts
- Filter: Nurture Status = Active (via custom field) OR Tag = Active Nurture
- Group by: Assigned User
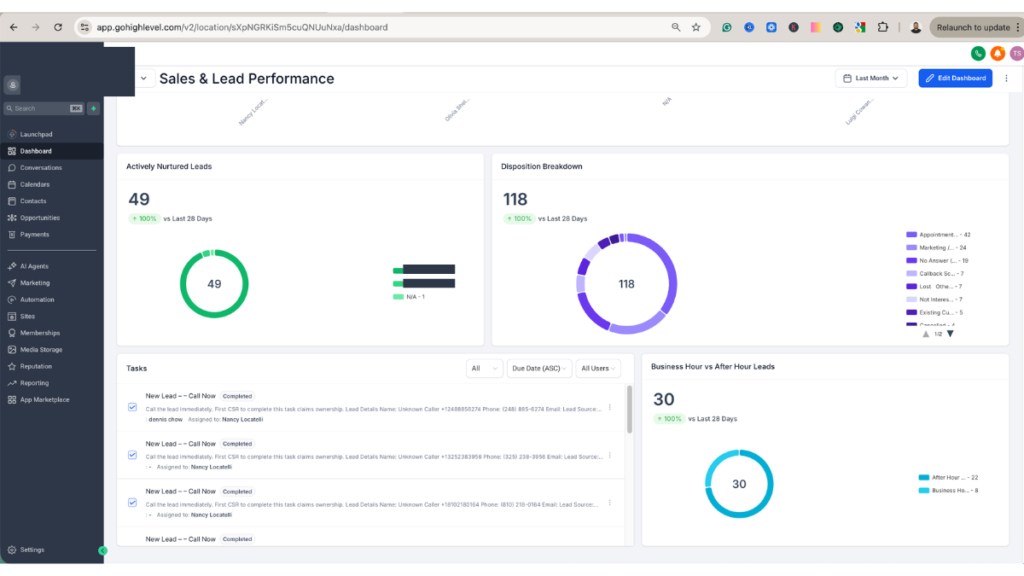
This is the widget most agencies never build — and it’s one of the most powerful things you can show a manager.
Having an open lead and actively working an open lead are two completely different things. This widget separates the two. It shows you which reps are genuinely engaging their leads versus which ones have a full pipeline but aren’t moving anything forward.
For this client, we used a custom field called Nurture Status. When a rep updates a lead’s nurture status to Active, it shows up here. Management can now have a real conversation about lead quality and rep engagement using actual data — not gut feel.
Need a CSR performance dashboard built for your team?
Section 3: Business Hours vs After-Hours Lead Tracking
This was the most unique section of the entire build — and it came directly from a real operational problem.
After-hours leads were being mixed in with daytime leads in every report. Management had zero visibility into how many leads were coming in outside business hours, whether those leads were being responded to quickly enough, or whether their automation was actually picking up the slack overnight.
Speed to lead was one of the core reasons this client moved to GHL in the first place. So if we couldn’t measure it by time of day, we were missing the whole point.
The Workflow I Built to Make This Work
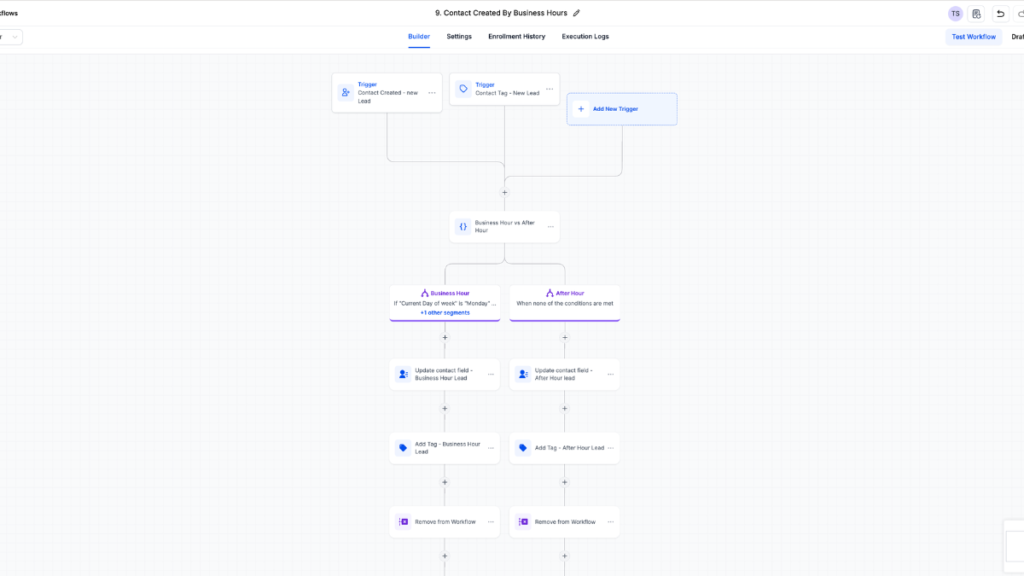
I built a GoHighLevel workflow that fires the moment a new lead tag is added to a contact.
Trigger: Contact tag added (new lead tag)
Logic — If/Else Branch:
If the contact is created Monday through Friday AND the time is between 9 AM and 5 PM:
- Update custom field → Business Hours Lead
- Add tag → Business Hours (for quick filtering in contact views)
Else (evenings, weekends, or outside those hours):
- Update custom field → After Hours Lead
- Add tag → After Hours
Dashboard Widget:
- Widget type: Contacts
- Group by: Custom Field (Business Hours Lead / After Hours Lead)
Now the dashboard shows exactly how lead volume splits across business and after-hours windows. Management can see:
- How many leads are arriving outside staffing hours
- Whether automation is handling the after-hours volume properly
- Whether staffing decisions need to change based on when leads actually come in
- Whether the lead provider is sending quality leads during hours when reps can act on them immediately
This section connects reporting to automation in a way that has a direct impact on speed to lead – and ultimately, on close rate.
Full Dashboard Layout at a Glance
Section 1 — Revenue & Win/Loss Performance
- Win/Loss Breakdown
- Lost Reason Analysis
- Win Rate by Source
- Win Rate by Rep
- Revenue by Trade
- Revenue by Source
Section 2 — CSR Lead Management
- Open Leads by Rep
- Active Nurtures by Rep
Section 3 — Operational Volume
- Business Hours Lead Volume
- After Hours Lead Volume
- Leads by Source
Structured top-down: revenue first, rep performance second, operational volume third. Executives, managers, and operations each get exactly what they need without digging through irrelevant data.
Like tutorials in videos? Watch the set up in YouTube:
What Most Agencies Get Wrong With GoHighLevel Dashboards
Worth calling out, because these mistakes are everywhere:
They don’t separate Contacts from Opportunities. They try to pull revenue data from Contact reports and wonder why the numbers don’t add up.
They don’t track nurture status. So there’s no way to tell whether a lead is being worked on or just sitting assigned to someone.
They ignore rep-level performance. The default dashboard shows totals, not breakdowns. No one gets held accountable.
They never build time-based segmentation. After-hours lead volume is invisible, which means speed-to-lead problems stay invisible too.
They add widgets without a strategy. A dashboard isn’t a collection of charts. It’s a reporting system — and it should be designed like one.
A well-built GoHighLevel custom dashboard mirrors how your business actually operates. It’s not about more data. It’s about the right data, for the right person, at the right level of the business.
Results This Dashboard Delivered
- Full win/loss transparency across every trade and lead source
- Revenue visibility broken down the way leadership actually thinks about the business
- CSR accountability without needing daily check-in calls
- Clear workload distribution across the team
- Measurable after-hours lead performance tied directly to automation
- Faster, more confident decision-making at every level of the business
Want This Built for Your Business?
If you’re running a team on GoHighLevel and your dashboard isn’t showing you any of this — you’re operating blind. You’re making staffing decisions, marketing decisions, and rep coaching decisions without the data to back them up.
I build custom GoHighLevel reporting systems, CSR performance dashboards, and lead tracking workflows for service businesses. [Reach out here] and let’s map out what your reporting should actually look like.
Want the full technical breakdown of this exact build — including the disposition system, custom fields, pipeline structure, and full workflow logic?